

Story Highlights
- The Bitcoin Fear and Greed index at 72% highlights the market sentiment remains strongly bullish.
- The falling BTC price witnessed a high demand pressure at $61600.
- The intraday trading volume in Bitcoin is $66.9. Billion, indicating a 79% gain.
Bitcoin Price Forecast: This week has been nothing short of tumultuous in the cryptocurrency sphere, with notable fluctuations driven by a confluence of factors. The market initially found itself besieged by pronounced selling pressure, largely stemming from the looming uncertainty surrounding the eagerly anticipated Bitcoin halving event. Concurrently, geopolitical tensions roiled the Middle East, injecting an additional layer of apprehension into an already volatile landscape.
As these dual forces collided, the market witnessed a swift and dramatic repricing, with Bitcoin, the flagship cryptocurrency, bearing the brunt of the downturn. Plummeting to a low of $61,600, Bitcoin’s price charted a trajectory that underscored the prevailing apprehension and apprehensiveness among investors. The reverberations of this price action were keenly felt across the broader altcoin market, as many major cryptocurrencies succumbed to the downward pressure and embarked on a corrective phase of their own.
However, amidst the prevailing uncertainty and market turbulence, a pivotal question emerges: will the forthcoming Bitcoin halving event serve as a catalyst for renewed optimism and propel market sentiment back into the domain of buyers? The halving, a highly anticipated and meticulously scrutinized event within the cryptocurrency community, holds the potential to significantly impact the supply dynamics of Bitcoin, thereby exerting a profound influence on its price trajectory.
Historically, Bitcoin halving events have been associated with periods of heightened volatility and speculation, as market participants grapple with the implications of a diminished block reward and the ensuing supply shock. Against this backdrop, there exists a palpable sense of anticipation surrounding the impending halving, with many stakeholders eagerly awaiting its arrival in anticipation of potential market-altering ramifications.
Yet, amidst the fervent speculation and conjecture, one thing remains abundantly clear: the cryptocurrency market is no stranger to volatility and unpredictability. As such, any attempts to forecast the precise outcome of the forthcoming halving must be tempered with a healthy dose of caution and circumspection.
While the recent market turbulence may have cast a shadow of doubt over the near-term outlook for Bitcoin and the broader cryptocurrency market, the impending halving event looms large as a potential catalyst for renewed optimism. Whether it will succeed in reigniting bullish fervor and ushering in a new era of price appreciation remains to be seen. However, one thing is certain: in the ever-evolving landscape of cryptocurrency, only time will tell.
Will BTC Price Lose $60000 Amid Market Sell-off?
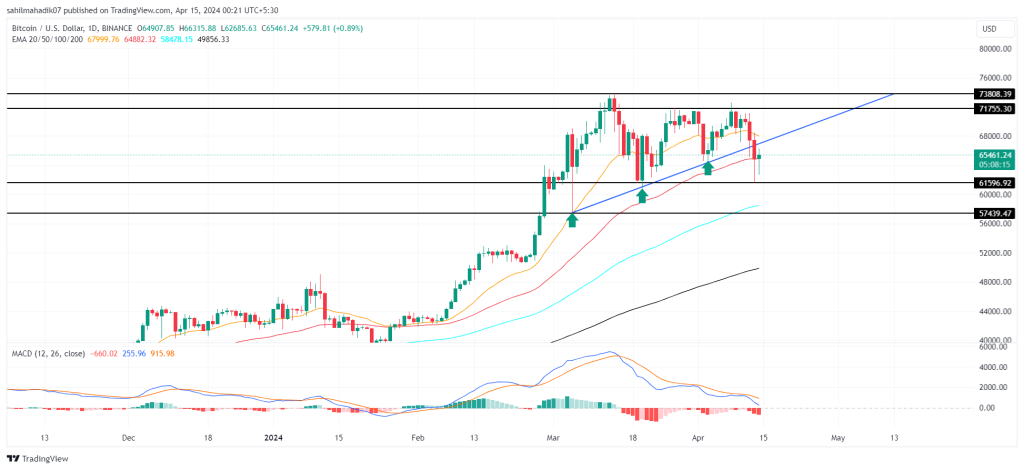
Over the course of the past sixty days, the trajectory of Bitcoin’s price has been characterized by a persistent struggle to overcome the formidable supply pressure entrenched at the $73,800 mark. This enduring battle for upward momentum culminated earlier this week in the establishment of a new, lower high at $71,755—a development that could be interpreted as an ominous harbinger signaling the inclination of traders to capitalize on any bullish rebounds.
The consequential reversal from this critical resistance level precipitated an alarming 8.3% decline in the valuation of Bitcoin, which currently languishes at $65,281. However, the situation was further compounded by the eruption of geopolitical tensions between Iran and Israel, triggering an unprecedented nosedive in BTC’s price to a distressing low of $61,600. It was at this juncture that the intrinsic role of Bitcoin as a veritable macro hedge in the volatile landscape of the financial markets came to the fore, catalyzing a palpable resurgence in its value.
Adding fuel to the fire of market dynamics, a significant Bitcoin whale made a strategic maneuver by withdrawing a staggering 598 BTC from Binance amidst the prevailing market downturn. This maneuver was part of a larger, orchestrated withdrawal totaling a jaw-dropping 10,158 BTC since the middle of March, as meticulously tracked and documented by Lookonchain. This calculated series of withdrawals, collectively amounting to an astronomical sum of approximately $680.83 million, underscores a shrewd and strategic response to the prevailing market conditions.
In the face of this backdrop, the consistent and unwavering accumulation of Bitcoin during this corrective phase serves as a testament to the foresight and conviction of astute investors who foresee an imminent rebound in its price trajectory. This steadfast accumulation strategy appears to signal a collective expectation among sophisticated market participants that Bitcoin is poised to once again challenge the overhead resistance barriers and potentially carve out new historic highs.
In the event that this anticipated reversal gains traction and sustains momentum above the critical 50-day Exponential Moving Average (EMA), it is conceivable that buyers will be emboldened to mount a concerted assault on the resistance thresholds positioned at $71,755 and $73,800, respectively.
However, it is imperative to acknowledge the existence of downside risks amidst the prevailing market volatility. Accordingly, prudent investors would be well-advised to closely monitor the levels of support, which are anticipated to materialize around the psychologically significant benchmarks of $61,600 and $57,400. These support zones represent crucial bastions of defense against potential further downside movements in Bitcoin’s price trajectory.
Technical Indicator
The Exponential Moving Average (EMA), particularly the slope of the 50-day EMA, emerges as a pivotal factor furnishing buyers with a robust support mechanism amid the ongoing market correction. This key technical indicator delineates the average price of Bitcoin over a 50-day period, placing greater emphasis on recent price movements. Its slope serves as a barometer of the prevailing market sentiment, offering valuable insights into the momentum and direction of price trends.
During periods of correction, the upward slope of the 50-day EMA acts as a beacon for buyers, signaling opportune entry points and bolstering confidence in the underlying strength of Bitcoin’s price trajectory. The consistent upward trajectory of this moving average instills a sense of reassurance among investors, indicating a sustained bullish bias and potentially mitigating the impact of short-term fluctuations.
On the other hand, the Moving Average Convergence Divergence (MACD) serves as another indispensable tool for technical analysis, offering valuable signals about potential shifts in market momentum. A bearish crossover between the MACD and its signal line serves as a clear indication of an active correction trend in Bitcoin. This occurs when the MACD line, representing the difference between the 12-day and 26-day exponential moving averages, crosses below the signal line, signaling a weakening of bullish momentum and a potential downturn in price.
As such, the convergence and divergence of these moving averages provide traders with actionable insights into the prevailing market dynamics, enabling them to make informed decisions about entry and exit points. By closely monitoring the interplay between these key technical indicators, market participants can adeptly navigate the complexities of the cryptocurrency market and capitalize on lucrative trading opportunities.
Related Article Bitcoin Halving Just 10 Days Away! Will BTC Price Flash A Different Trend This Time?