

Commencing the analysis with a bearish tone, Bitcoin experiences an immediate 1% decline at the current moment as momentum is released. Despite days of consolidation, the BTC price fails to draw positive influence from the S&P 500, even as it achieves a two-year high.
As the total crypto market cap tests the 50-day EMA at $1.573 trillion, Bitcoin exhibits strong bearish signals. Nevertheless, amid the lukewarm sentiments, optimistic Bitcoin price predictions rooted in Halving and potential rate cuts remain.
Bitcoin Price Signals a Potential 6% Downside with Trendline Breakdown
After concluding last week with a consolidation period amidst bearish trends, sellers are gearing up for significant moves this week. Currently down by 1.08%, the BTC price is scrutinizing the critical support zone around the $41K mark.
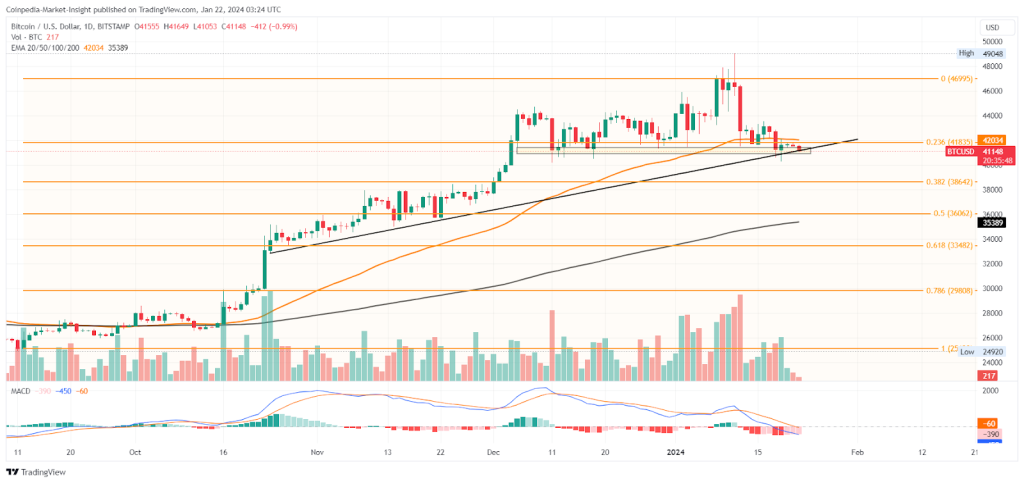
Source: Tradingview
Buyers have surrendered the 50-day EMA and the 23.60% Fibonacci level in the recent upswing, establishing seller dominance in the short-term trend. The increasing intensity suggests a potential significant pullback in BTC price, jeopardizing the formation of higher lows.
The ongoing struggle for the upcoming trend hinges on the support trendline. Aligned with the support zone, the identified trendline serves as a pivotal reversal point for the BTC price.
The Data on Options Indicates a Critical Turning Point
With Bitcoin’s open interest across exchanges reaching $14.29 billion, Coinglass reveals 208,692.47 BTC in Calls and 95,852.52 BTC in Puts. This yields a put-call ratio below 1, indicating a preference for call options.
However, the PCR ratio lacks contract volume data. Coinglass notes a bullish trend with 54.42% of volume in calls. Uncertainty about expiration dates raises doubts about metric reliability, cautioning against relying solely on this trend. Additionally, the PCR ratio may signal an overbought market.
As of now, BTC is priced at $41,003, and an intraday candle hints at a potential breakdown rally.
Technical Indicators:
MACD Indicator: Following a recent bearish crossover, both the MACD and signal lines have dipped below the halfway point. This suggests a downward trend in Bitcoin, as indicated by the momentum indicator.
Can Bitcoin’s Price Maintain its Stronghold at $40,000?
With the sentiment crisis deepening, the pivotal support zone around $41,000 is showing signs of vulnerability. A confirmed breakdown would serve as a clear sell signal for cautious traders, potentially leading to a BTC price decline targeting the 38.20% Fibonacci level at $38,642.
Conversely, a bullish reversal could prompt a rebound towards the upper resistance at $46,758.