The Bonk price forecast depicts a neutral trend on the chart, with both bears and bulls vying for control on the daily timeframe. Sellers attempted to push the price below the 50-day moving average, but buyers countered, lifting it above the said average. The overall trend remains uncertain.
As per TradingView, Bonk’s current price stands at $0.0000140598, showing an intraday loss of approximately 1.10%. The coin boasts a 24-hour trading volume of 191.847 million and a market cap of $890.735 million.
Despite recent mild weakness, Bonk has delivered remarkable returns, surging by 3910.32% in the last 6 months and 7064.65% in the last 3 months. The technical summary on TradingView reveals 5 indicators on the sell side, 9 neutral, and 11 on the buy side, signaling a positive outlook for the BONK price.
Can Bonk Price Maintain its Bullish Momentum or Face a Downward Correction?
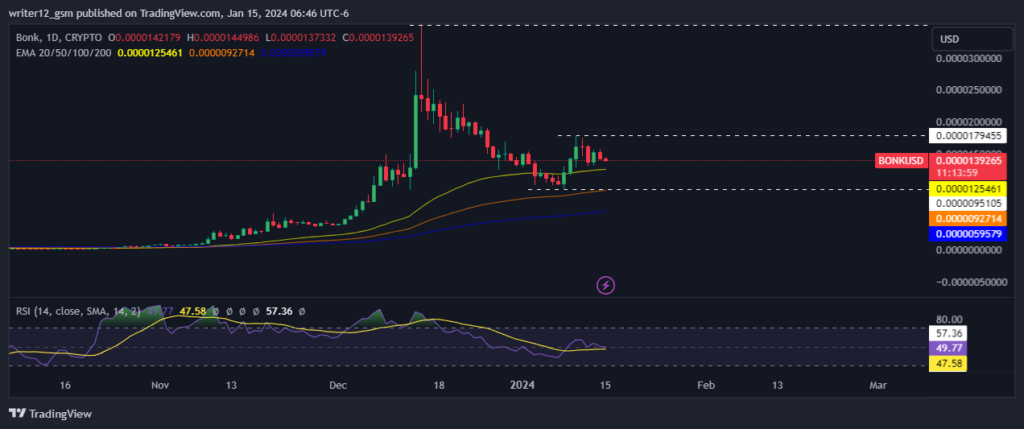
Source: Tradingview
On the daily timeframe, BONK price remains above the significant 50, 100, and 200-day EMAs, indicating bullish activity. The RSI hovers around 49.98, and the 14 SMA is at 47.59, signaling a neutral stance.MACD consolidation near the zero line reflects trend neutrality, while the price lingers around the middle Bollinger band, reinforcing this neutral outlook.In summary, daily technical indicators suggest neutrality. A surge to higher levels requires increased buyer participation, and sustaining current levels may lead to upward movement. Conversely, breaking below key moving averages could prompt a decline to lower levels. Investors and traders are advised to await a confirmed price direction before making decisions.
Technical Levels
Support Levels: BONK crypto price finds immediate support at $0.0000095105.
Resistance Levels: Immediate resistance for Bonk crypto price is observed at $0.0000179455.
Conclusion
The BONK price forecast indicates an unclear trend, with both bears and bulls yet to grasp the full direction. Investors might opt to await convergence of various technical indicators for a clearer trend signal. The ascending green candle suggests a gradual increase, signaling buyer interest in the demand zone.