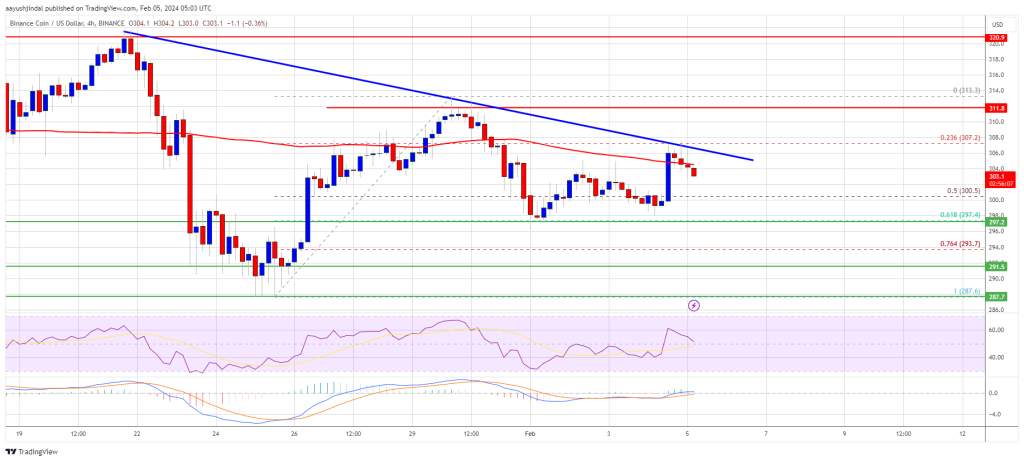
BNB price is currently in a crucial position as it attempts a fresh increase from the $288 zone. Despite facing resistance around the $310 level, the price is showing signs of strength above the $300 pivot level, exhibiting bullish momentum. The recent correction from the $313 high brought the price below the $308 level, but it is now consolidating near $305 and the 100 simple moving average (4 hours).
On the 4-hour chart of the BNB/USD pair, a key bearish trend line is forming with resistance near $306. This trend line, along with the $310 resistance, is pivotal for the next move. A clear break above this resistance zone could trigger a renewed rally. The MACD (Moving Average Convergence Divergence) for BNB/USD is currently losing pace in the bullish zone, indicating a slight slowdown in the positive momentum. However, the RSI (Relative Strength Index) is holding above the 50 level, suggesting that the overall sentiment remains positive.
In case of a successful break above the $310 resistance, the price might test the $320 level. Further gains could open the door for a larger increase towards the $335 resistance, with potential upside targets at $350. On the downside, failure to clear the $310 resistance may lead to a continuation of the correction. Initial support is seen near $300, followed by a significant support level at $292 or the 76.4% Fib retracement level. The main support zone lies at $288, and a breach below it could result in a deeper decline towards $275 and $262.
Traders and investors should closely monitor the price action around the critical levels of $308, $310, and $320 for potential trend confirmations and reversals in the coming sessions. The overall market sentiment and the resolution of these key levels will play a crucial role in determining the next major direction for BNB price movements.


