
Ethereum’s Coinbase Premium Index (CPI) has surged to its loftiest level since May 2023, signaling a remarkable surge in market engagement among US-based investors, as per data from CryptoQuant. This index, a crucial metric, tracks the difference in asset prices between Coinbase and Binance. A rising CPI indicates substantial buying activity on Coinbase, while a decline or negative readings suggest reduced trading on this US-based platform.
At the time of reporting, Ethereum’s CPI stands at a notable 0.16, marking its highest level since May 9th, 2023, according to CryptoQuant’s analysis. This surge has been relentless since February 23rd, skyrocketing by a staggering 400%.
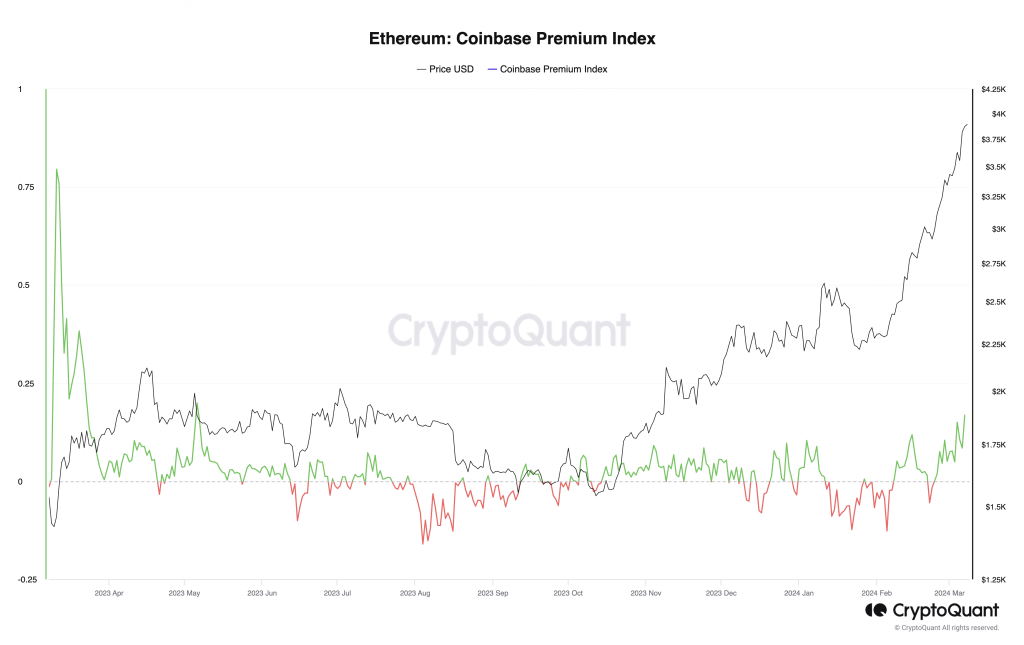
This surge in Ethereum’s CPI is directly correlated with its recent bullish run beyond the $3,800 mark. It serves as a powerful testament to the prevailing bullish sentiment in the market, with investors eagerly anticipating Ethereum’s ascent to reclaim its historic all-time high of $4,800, established two years ago.
Meanwhile, similar optimism reverberates across the Asian market. Ethereum’s Korean Premium Index (KPI) has also surged, reaching its highest level since May 2022.
The synchronous rally observed in both Ethereum’s CPI and KPI underscores an unprecedented surge in investor activity across both US-based and Asian markets. This surge indicates a renewed vigor and confidence in Ethereum’s potential, reflecting a significant uptick in market participation and reaffirming Ethereum’s position as a leading cryptocurrency.
Demand remains at an ultra-high level
As of the most recent update, Ethereum (ETH) is commanding a price of $3,890, marking a significant 3% surge within the last 24 hours, according to the latest data from CoinMarketCap.
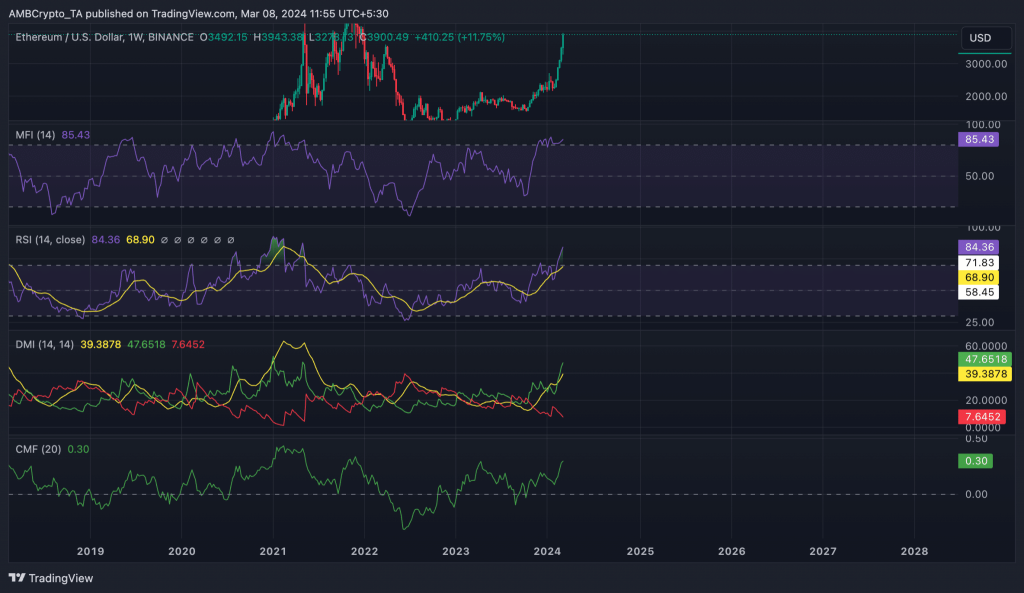
Despite encountering notable resistance at this price threshold, Ethereum’s resilience is evident as buying pressure continues to dominate, outweighing any potential sell-offs. A thorough analysis of Ethereum’s key momentum indicators on a weekly chart reaffirms this bullish sentiment.
Currently, both the Relative Strength Index (RSI) and the Money Flow Index (MFI) are trending upwards, boasting impressive values of 84.36 and 85.43, respectively. These robust readings suggest a substantial influx of buying pressure, indicating a prevailing bullish sentiment in the market.
Furthermore, Ethereum’s Chaikin Money Flow (CMF) is experiencing a notable rally, indicating a consistent inflow of liquidity into the Ethereum spot market. With the CMF currently standing at 0.29, this positive value underscores market strength, hinting at increased capital allocation by traders into Ethereum.
Moreover, the confirmation of this bullish trend comes from Ethereum’s positive directional index (green), which firmly dominates its negative counterpart. When these lines of an asset’s Directional Movement Index (DMI) indicator assume such a configuration, it signifies a clear dominance of buyers in dictating market sentiment and direction.
In summary, Ethereum’s current market dynamics, as illuminated by various momentum indicators, depict a robust and optimistic trend characterized by substantial buying pressure and favorable market conditions. This bullish momentum bodes well for Ethereum investors, suggesting potential further upward price movements in the near future.