
Summary
- Indications from the EMA revealed that WIF could decline to $3.00.
- FLOKI was oversold, suggesting a rebound, while PEPE might drop to $0.0000067.
- BONK’s sellers’ fatigue could help the price climb in the $0.000030 direction.
In the wake of their spectacular surges, the performance of several prominent meme coins has been nothing short of lackluster, with prices struggling to maintain their momentum. This trend has sent shockwaves through the crypto sphere, particularly evident in the recent downturn of dogwifhat’s (WIF) token, which nosedived by a staggering 13.65% within the last 24 hours.
Adding fuel to the fire, the frog-themed Pepe (PEPE) token experienced a notable decline of 8.48%, echoing the sentiment of disappointment that has permeated the meme coin market. But the narrative doesn’t end there—Floki (FLOKI) and Bonk (BONK), both stalwarts in the meme coin arena, weren’t spared either, witnessing a significant drop of 7.84% each during the same period.
This abrupt and substantial downturn serves as a clarion call, signaling a potential ebb in enthusiasm for meme coins at large. Investors, once captivated by the allure of these quirky digital assets, now find themselves grappling with the reality of an increasingly uncertain market landscape.
Should this downtrend persist unabated, the ramifications could reverberate far beyond the confines of meme coins alone. A sustained lack of interest in cryptocurrencies could cast a pall over the broader digital asset market, making it arduous for prices to stage any meaningful recovery in the foreseeable future.
It is against this backdrop of uncertainty and apprehension that Coin Edition steps in, wielding its analytical prowess to dissect and decipher the intricate dynamics at play within the meme coin ecosystem. With a keen eye on the short-term trajectory of these tokens, Coin Edition endeavors to provide investors with invaluable insights that could prove instrumental in navigating the choppy waters ahead.
While the recent price movements of meme coins may appear disheartening, they serve as a poignant reminder of the inherent volatility and unpredictability that characterize the world of cryptocurrencies. As stakeholders brace themselves for what lies ahead, the need for informed decision-making and prudent risk management has never been more paramount.
dogwifhat (WIF)
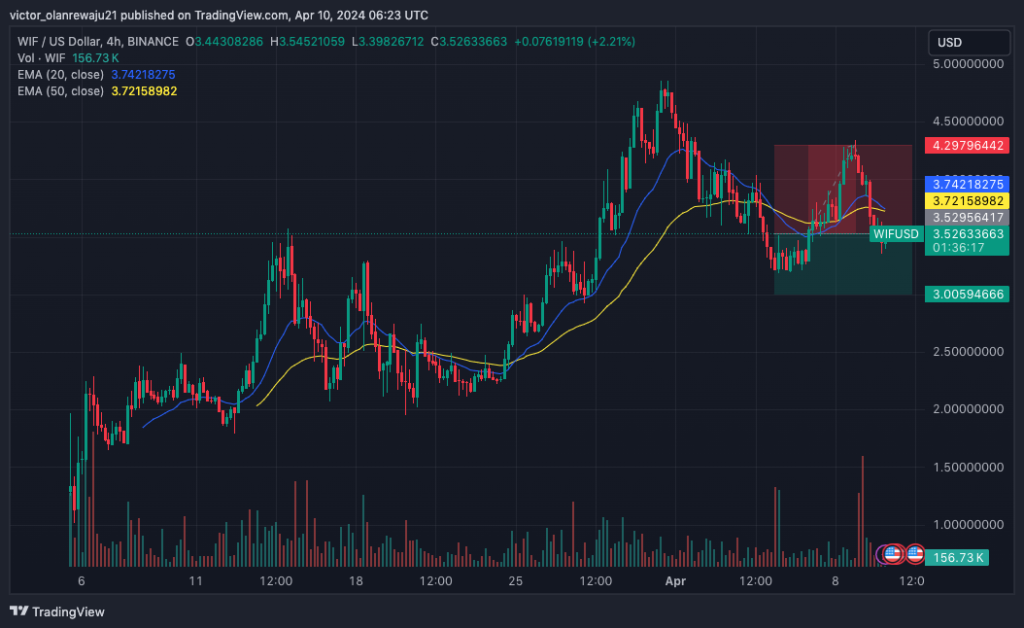
At the onset, WIF surged to a noteworthy $4.34 on April 8, poised with the ambition to reclaim its illustrious all-time high. A momentary glimmer of hope sparked amongst investors and enthusiasts alike. Yet, alas, this hopeful ascent was swiftly quelled by the ferocious bears prowling the market depths, mercilessly driving the price down to a sobering $3.51. It was a stark reminder of the volatility that characterizes the cryptocurrency landscape.
Delving into the intricacies of the 4-hour chart, one couldn’t overlook the telling tale inscribed by the Exponential Moving Averages (EMAs). The 20 EMA, painted in a resolute shade of blue, stood defiantly above its golden counterpart, the 50 EMA, casting a shadow of optimism across the horizon, suggesting the potential dawn of a bullish trend.
Yet, amidst the fervent anticipation of a bullish resurgence, a cruel twist of fate unfolded. The price of WIF cascaded beneath both EMAs, a grim testament to the overwhelming force of selling pressure that had laid waste to the bullish thesis painstakingly constructed by the hopeful few. It was a bitter pill to swallow for those who dared to dream of a triumphant rally.
As the dust settled and the echoes of disappointment reverberated through the market, a somber realization dawned upon the collective consciousness. Unless there emerged a seismic shift in sentiment, an abrupt about-face towards bullish fervor, the trajectory of WIF seemed ominously set upon a path of continued descent, charting a course through the treacherous waters of uncertainty.
Peering into the murky depths of the future, one could discern faint whispers of potential outcomes. Should the prevailing downtrend persist unabated, the next formidable barrier loomed ominously at the $3.00 mark, a daunting prospect for those clinging to the hope of recovery. Conversely, should the bulls summon the courage to wrest control from the iron grip of the bears, the tantalizing promise of a resurgence beckoned, with a tentative target set at $4.29, a beacon of hope amidst the prevailing gloom.
In this turbulent saga of highs and lows, twists and turns, one thing remained abundantly clear – the fate of WIF hung precariously in the balance, swayed by the capricious whims of market sentiment, awaiting the decisive hand of fate to chart its course amidst the tempestuous seas of the crypto realm.
Pepe (PEPE)
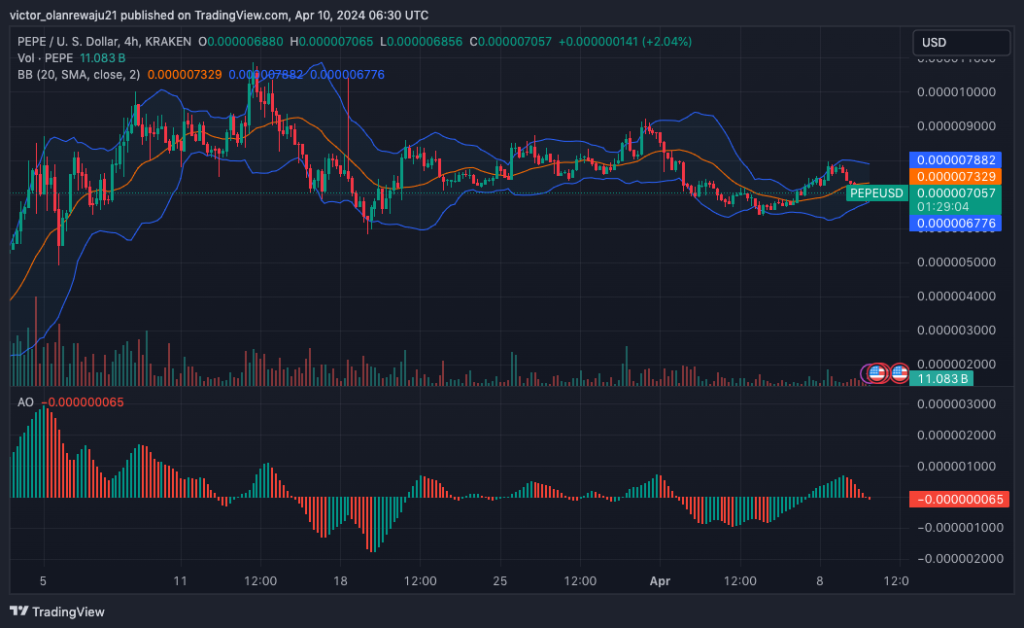
PEPE’s market structure exhibited striking similarities to that of WIF, particularly evident in its recent attempt to breach the $0.0000080 mark, only to face staunch resistance. As of the latest data available, PEPE was trading at $0.0000070, a testament to the ongoing battle between bulls and bears within its trading ecosystem. This price action underscores the delicate balance of market forces at play.
Moreover, a closer examination of volatility, gauged through the lens of the Bollinger Bands (BB), reveals a notable evolution. Recent days have witnessed a discernible improvement in volatility levels, reflecting the ebb and flow of market sentiment surrounding PEPE. This nuanced insight into volatility dynamics serves as a crucial backdrop for understanding the token’s price movements and potential future trajectories.
Delving deeper into the technical analysis, the Bollinger Bands (BB) offer insightful signals regarding potential price targets for PEPE. Within a highly bullish scenario, there exists a tantalizing prospect of PEPE surging towards the $0.0000078 mark. However, this optimistic outlook must be tempered by the acknowledgment of potential downside risks. In the event of a sustained bearish phase, PEPE could face the daunting prospect of retracing to $0.0000067, underscoring the inherent volatility and uncertainty within the cryptocurrency market.
Adding another layer of complexity to the analysis is the assessment of the Awesome Oscillator (AO), which has trended into negative territory. This ominous development suggests a growing downward momentum for PEPE, potentially exacerbating the prevailing bearish sentiment. The implications are profound, hinting at a possible protracted period of decline rather than an imminent recovery.
In summary, the intricate interplay of technical indicators and market dynamics paints a nuanced picture of PEPE’s current trajectory. While the token’s attempt to breach key resistance levels underscores its inherent strength, the presence of formidable obstacles and bearish signals warrants caution. As investors navigate this complex landscape, a comprehensive understanding of both bullish and bearish scenarios is essential for making informed decisions in an ever-evolving market environment.
Floki (FLOKI)
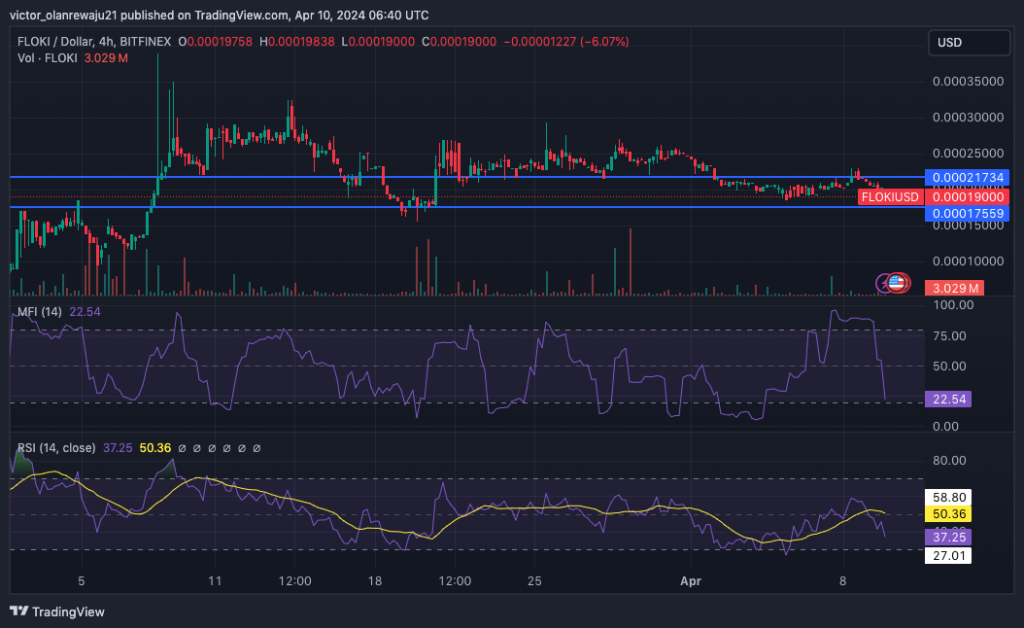
Analyzing the FLOKI/USD 4-hour chart reveals a dynamic interplay of resistance and support levels, guiding the trajectory of this meme coin. At a crucial juncture, a formidable barrier manifested at $0.00021, staunchly obstructing FLOKI’s ascent towards the coveted $0.00030 threshold. This resistance zone, characterized by historical price action, underscores the significance of investor sentiment and market dynamics in dictating FLOKI’s price movements.
Conversely, amidst this apparent standoff, a resilient support level emerged at $0.000017, serving as a resilient bulwark against a potential downturn. This foundational support implies a strategic equilibrium in the market, where bullish forces strive to maintain control and prevent the price from plummeting below the psychologically significant $0.00015 mark.
However, the plot thickens with the emergence of crucial technical indicators, namely the Money Flow Index (MFI) and the Relative Strength Index (RSI). These indicators, revered by seasoned traders and analysts alike, illuminate the underlying market sentiment and signal potential turning points in FLOKI’s price trajectory.
Of particular note is the MFI’s revelation of oversold conditions, suggesting an imbalance in supply and demand that could precipitate a swift reversal in fortunes. This oversold status underscores the possibility of a bullish resurgence, as market participants seek to capitalize on perceived undervaluation and drive prices higher.
Furthermore, the RSI echoes this sentiment, offering a corroborative glimpse into the underlying strength of FLOKI’s price action. Its alignment with the MFI’s signal of oversold conditions amplifies the conviction surrounding a potential bullish reversal, imbuing investors with a sense of anticipation and opportunity.
In light of these compelling technical insights, the stage is set for a potential inflection point in FLOKI’s price trajectory. Should mild buying pressure materialize at this critical juncture, catalyzed by the convergence of oversold conditions and resilient support, FLOKI’s price may embark on a trajectory towards the $0.00021 level.
However, the realization of this bullish scenario hinges on the proactive intervention of market participants, particularly the Bulls, who must exhibit resilience and determination in defending the support area. Their strategic maneuvers will play a pivotal role in capitalizing on the prevailing market dynamics and propelling FLOKI towards its next price target.
In conclusion, the confluence of technical indicators and critical support and resistance levels paints a nuanced picture of FLOKI’s current market landscape. By leveraging these insights, investors can navigate the complexities of the meme coin market with greater confidence and precision, poised to seize opportunities and capitalize on emerging trends.
Bonk (BONK)
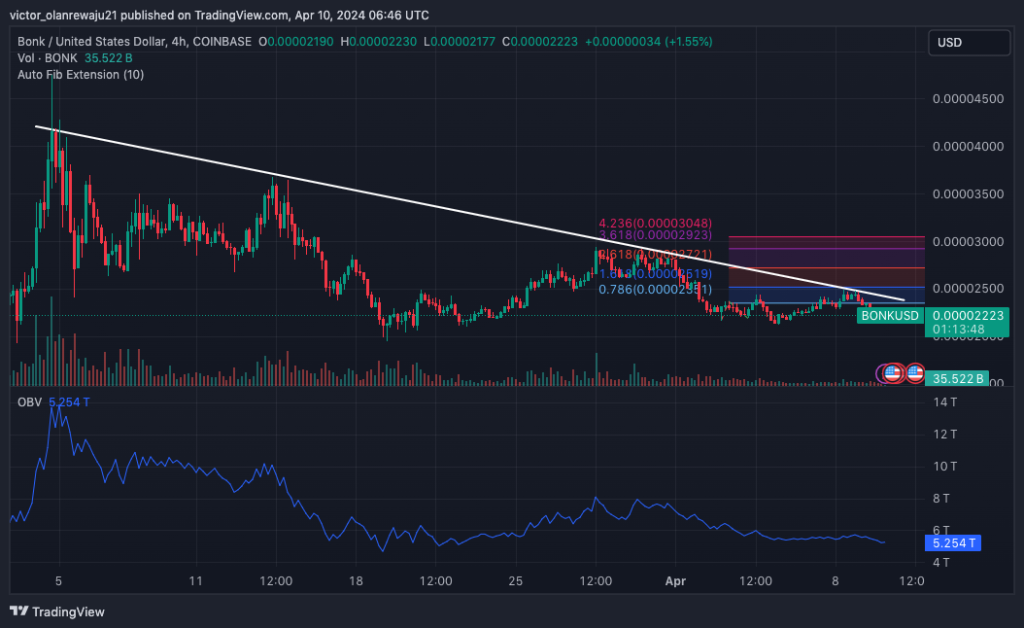
The downward trajectory experienced by BONK has been nothing short of profound, marking a notable plunge from its previous standing at $0.000041 to a mere $0.000022 over the span from March to the present. This decline has been starkly evident, painting a picture of considerable volatility and uncertainty within the market.
Despite this discouraging trend, there’s a glimmer of hope amidst the chaos, as hinted by the Fibonacci extension analysis. This technical tool suggests the potential for a recovery, albeit in the short term, for this whimsically named meme coin.
However, it’s crucial to temper expectations, as the projected targets set by this analytical approach pale in comparison to BONK’s former heights. From a bullish standpoint, there exists a possibility that the price could ascend to $0.000030, aligning with the 4.236 Fibonacci level.
Yet, such an ascent is contingent upon a substantial influx of buying pressure. Herein lies the rub: the current readings from the On Balance Volume (OBV) indicator reveal a distinct lack of such buying momentum for BONK. Without this crucial impetus, the path forward appears fraught with continued downward pressure.
Thus, the prevailing sentiment suggests that BONK’s price may, in fact, decline even further, possibly gravitating towards the $0.000020 mark, before any semblance of a rebound materializes. This nuanced interplay between technical indicators and market sentiment underscores the complexities inherent in navigating the volatile landscape of cryptocurrency trading, particularly within the realm of meme coins like BONK. As investors tread cautiously amidst these turbulent waters, the trajectory of BONK remains a compelling narrative to observe, with each fluctuation serving as a testament to the unpredictable nature of the market.