Story Highlights
- A healthy retracement sets the Pendle coin to rechallenge the $7.5 resistance for prolonged recovery.
- The midline of the Bollinger Band indicator acts as suitable dynamic support for Pendle.
- The intraday trading volume in Pendle is $201 Million, indicating a 20% loss.
Pendle, a decentralized finance (DeFi) protocol, recently proved its mettle in the face of a turbulent market landscape. Despite facing pressure that brought its coin price down to a support level of $4.9, Pendle swiftly bounced back, showcasing remarkable resilience. Within just three days, it underwent a remarkable surge, witnessing a staggering 42% growth that propelled its value to $6.97.
This swift and substantial recovery not only underscores Pendle’s strength amidst market volatility but also speaks volumes about the confidence investors have in its potential. Now, as the crypto community eagerly anticipates the upcoming Bitcoin Halving event, there’s a sense of excitement and anticipation surrounding the broader market. And in this climate, Pendle stands poised for further growth and recovery.
With the Bitcoin Halving event looming on the horizon, many are expecting a renewed surge in market activity and sentiment. This heightened interest is likely to have a positive impact on Pendle’s price, potentially driving it even higher. Investors are closely watching, eager to capitalize on Pendle’s resilience and potential for significant gains in the days to come. As the market braces for the halving event, all eyes are on Pendle, anticipating a continuation of its impressive performance and further gains in value.
Whale Transactions Hint at Cautious Optimism for Pendle Price Recovery

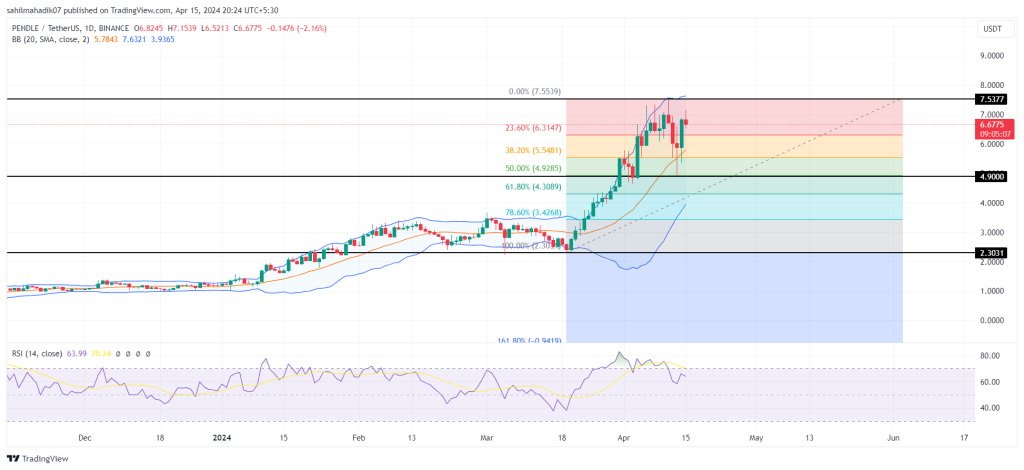
In the midst of a broader market that’s been consolidating, Pendle coin has been a shining example of resilience and recovery since mid-March. It’s like watching a comeback story unfold: from a low of $2.30, it surged an impressive 225% to hit a high of $7.53. But then, a geopolitical conflict in the Middle East caused a bit of a hiccup, sending Pendle’s price temporarily down to $4.9. However, just as quickly as it dipped, Pendle bounced back, reclaiming ground and rising back up to $6.88.
Now, let’s break down what’s been happening in the market. Analysts have been using something called the Fibonacci retracement tool to understand Pendle’s movement. What they found is that Pendle bounced back from the 50% pullback level, which is like a signal to investors that there’s some positive correction happening. This correction phase allowed buyers to gain back their strength and confidence in the coin.
With a 1% gain in a single day, it’s expected that buyers will try to push Pendle’s price even higher, aiming to break through the resistance level at the previous high of $7.53. If they succeed, that could open the door to even higher price targets, like $10 and $12.
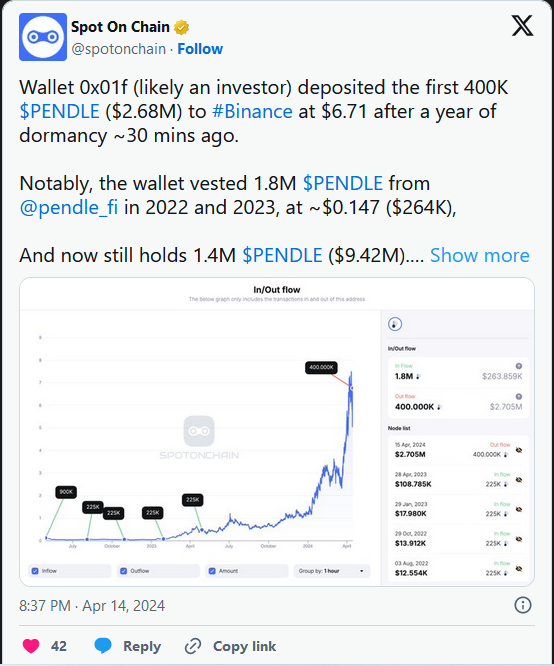
But here’s where it gets interesting. There’s been some recent activity reported by SpotOnChain that’s got people talking. Apparently, there was a big transaction involving a wallet known as 0x01f. This wallet had been dormant for a whole year before suddenly depositing a whopping 400K PENDLE tokens into Binance. That’s a transaction worth around $2.68 million! But that’s not all—the same wallet had previously received 1.8 million PENDLE tokens from Pendle Finance back in 2022, which were worth $264K at the time. Now, those tokens are worth a staggering $9.42 million!
So, what does all this mean for Pendle’s future? Well, it’s hard to say for sure. But one thing’s for certain: if Pendle’s price hits resistance at $7.5 and starts to drop, it could trigger a downward movement that takes it back below the $5 support level.
In conclusion, while Pendle’s recovery has been impressive, there are still some uncertainties in the market. Investors should keep a close eye on developments and be prepared to adjust their strategies accordingly.

Technical Indicators
- Relative Strength Index: The daily RSI slope at 65% hints a marker participants project a bullish outlook for Pendle.
- BB indicator: The upswing in the upper boundary of the Bollinger band indicator reflects retail buyers are still active toward this asset.


