Cryptocurrency analyst and professional trader Crypto Patel has voiced positivity regarding the future trajectory of XRP’s price. Patel has identified a distinct technical pattern within the XRP price chart that could potentially catalyze a significant price shift for the cryptocurrency.
In a post on X (formerly Twitter) published on Wednesday, Crypto Patel underscored key technical triangles forming in the XRP price chart, reminiscent of patterns observed in 2017 during the bullish cycle of the crypto market.
The analyst shed light on the hurdles XRP encountered during the crypto market’s remarkable 40,000% surge in 2017. Despite Bitcoin reaching previous highs, XRP struggled to align with bullish trends, ultimately failing to surpass its all-time high of $3.30 at the time.
Moreover, throughout its protracted three-year legal battle with the United States Securities and Exchange Commission (SEC), the cryptocurrency faced persistent challenges, resulting in a series of price declines. However, following a partial victory and gaining legal clarity in its SEC battle, Crypto Patel anticipates a brighter future for XRP.
The analyst has suggested a potential resurgence of the bullish trend observed in 2017. He revealed that with XRP’s recent legal triumph, current conditions may offer a more favorable environment for the cryptocurrency to leverage the opportunities presented by the technical pattern.
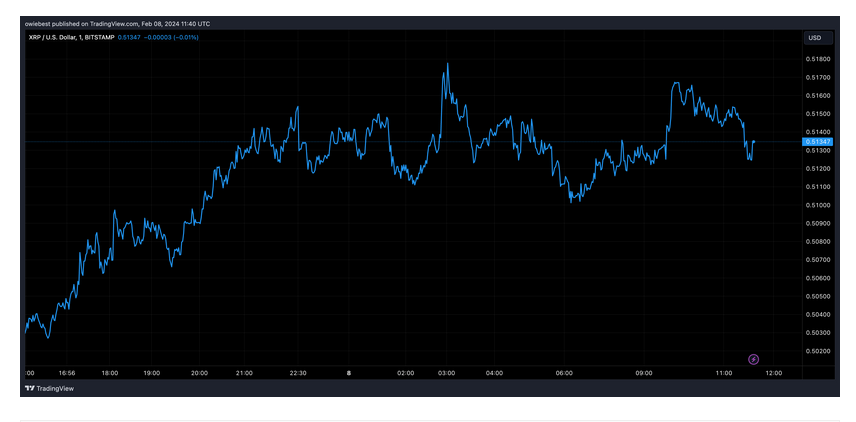
At the time of writing, XRP is trading at $0.51, as per CoinMarketCap. Despite enduring prolonged sluggish growth, described by Patel as enduring “2,291 brutal bear days,” he envisions a significant surge to $10, particularly if the crucial technical triangle pattern comes into play.
Crypto Analyst Predicts One Month Upswing For XRP Price
Likewise, another cryptocurrency analyst, Ali Martinez, recently posted an XRP price chart on TradingView on X, highlighting key technical indicators that suggest a potential rally in the coming weeks.
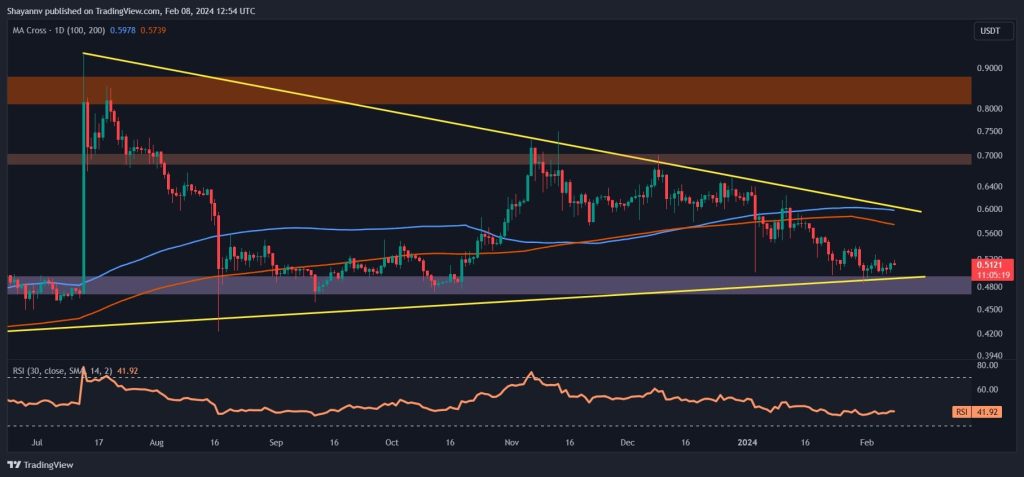
Martinez pointed out the Tom Demark (TD) Sequential Indicator, a robust tool for identifying trend exhaustion and potential price reversals, which is signaling a “buy” on the XRP weekly chart. Consequently, the analyst anticipates a potential uptick in the XRP price, with the expected duration ranging from one to four weeks.
The prospect of this impending rally may instill positive sentiment and optimism among XRP investors who have previously expressed concerns about the cryptocurrency’s declining performance and its failure to capitalize on the ongoing developments within the Ripple ecosystem.